Monitoring Windows disk space usage with vROps super metrics

Although vRealize Operations Manager (vROps) is a great tool for a variety of reasons, one of the more useful abilities it brings to a datacenter is the ability to look inside the guest OS and tell you about its state. Back in 6.2 or maybe 6.3, VMware added the ability to look at guest OS metrics. One of the things they added was guest file system stats on a per-drive basis. The available options as of vROps 6.6.1 look like this.
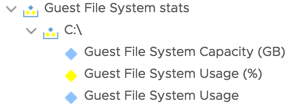
There is one that displays the usage in percentage, and two that show total capacity and usage in units of GB. What’s absent from this list is a metric that shows remaining disk space in terms of capacity (GB). Curiously, though, this metric was present back in 6.3 but has since been, for whatever odd reason, removed from later releases.
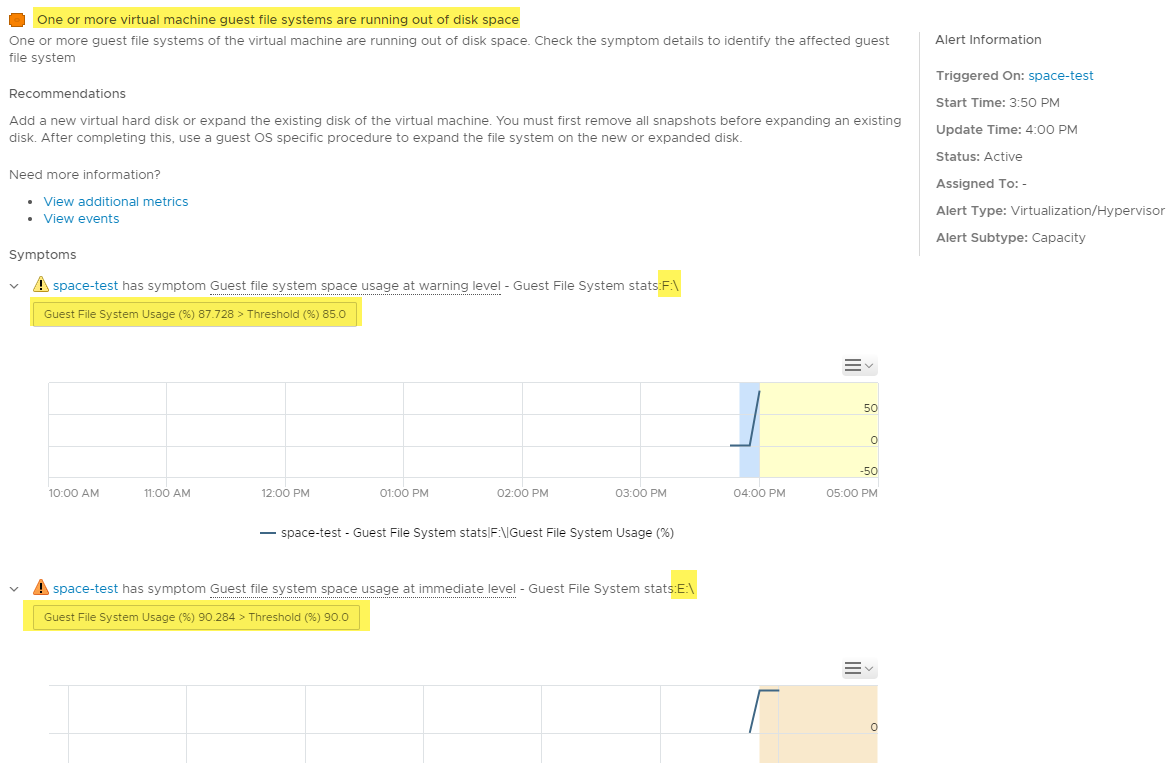
Now, as far as alerting goes, there is already a preexisting alert in vROps that uses the Guest File System Usage (%) metric to inform you on a per-drive or file system basis when capacity is running low. This alert definition is called “One or more virtual machine guest file systems are running out of disk space” and is based on symptoms of a percentage starting at 85% and going to 95%. And this works perfectly well as you can see from the triggered alert below.
Looks good, right? What’s the problem with that? It’s not a problem per-se, but a limitation on the flexibility of the alerting. Consider this scenario for a moment: You have a number of file server VMs with drives in the multi-terabyte range. Space isn’t consumed on a terribly rapid basis, but you still want to know when you’re running low. If you have a, say, 5 TB drive, using the default alert I showed above at the critical level of 95% capacity still leaves you with over 250 GB free. Probably not deathly critical if you’re not consuming space in a rapid manner. What would be better in these cases is to craft an alert based on arbitrary remaining capacity figures rather than remaining percentage. Unfortunately, vROps no longer has the metric necessary for us to make this happen. Happily, though, we can get this ability back through the use of super metrics. Read on to learn how restore this ability.
The goal here is to use the super metrics ability in vROps to create a new metric that tells us on a per-drive basis the remaining capacity in GB. Using that new metric, we can create new symptoms, and using those symptoms we can create a new alert. Although this is a mildly-involved process, you fortunately only need to endure it once and never again regardless of how many different drives you might eventually have on systems. In order to carry out these steps, we need a few prerequisites to move forward.
- A disposable Windows VM. Can be almost any OS. Best not to use an existing VM that you care about, although these steps should be perfectly safe if you can’t create a new VM from template.
- Latest VMware Tools installed on test VM.
- vRealize Operations Manager 6.6 or better.
- A Windows-based workstation with PowerCLI 6.5.2 installed. Earlier versions should work but have not been tested.
In this tutorial, I have a disposable VM called “space-test” which I’ll use to set this up.
I am providing you with a few resources in this blog to make the process easier including a pre-constructed super metric that needs to be imported, and two Powershell scripts which can be used to add some test drives to your VM and format them inside Windows. Here’s the overall process we’ll follow.
- Deploy test Windows VM. Use PowerCLI script to add drives, and use Powershell script inside the guest to format them (both scripts provided).
- Import super metric provided here.
- Duplicate super metric enough times to cover all possible drive letters.
- Activate super metrics in your policy.
- Create a symptom definition using these super metrics.
- Create an alert using the new symptom definition.
I’ve already deployed the test Windows VM, so now we need to add drives. The idea with this is to add a drive for every letter in the alphabet that covers all possibilities you might encounter. Since A, B, and C are reserved, and you’ll likely have D as a virtual optical disk drive, we just need the rest of the letters. A simple PowerCLI script I’m providing you does all this in just a couple of lines.
1Connect-VIServer vcenter.domain.com -User myuser@domain.com -Password 'VMware1!'
2$vm = Get-VM -Name myvmname
3ForEach ($HardDisk in (1..22)){
4    New-HardDisk -VM $vm -CapacityGB 1 -StorageFormat Thin | New-ScsiController
5}
Be sure to edit the script accordingly to connect to your vCenter and provide your VM name. Also, ignore any errors you might warning that the VM must be in a powered off state as they’re false. If this is run successfully, you should have a bunch of 1 GB drives created on your test VM. After that, run the provided PS script inside the guest to bring them online and format them.
1Update-HostStorageCache
2$disknum = (Get-Disk | Where partitionstyle -eq 'raw').Number
3Foreach ($stuff in $disknum){
4  Initialize-Disk -Number $stuff -PartitionStyle MBR -PassThru |
5  New-Partition -AssignDriveLetter -UseMaximumSize |
6  Format-Volume -FileSystem NTFS -Confirm:$false
7}
Once complete, you should see this madness.

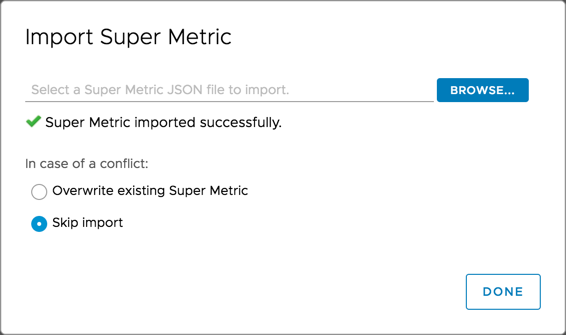
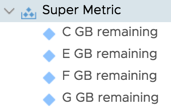
Go into vROps under Administration -> Configuration -> Super Metrics and import the JSON file provided for you.
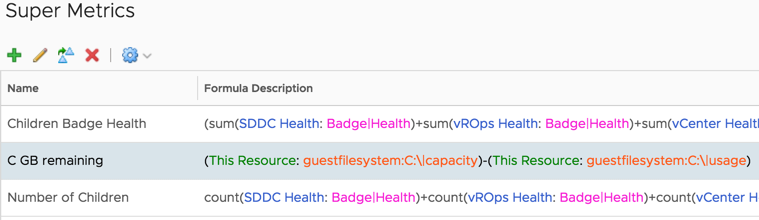
The result should be this.
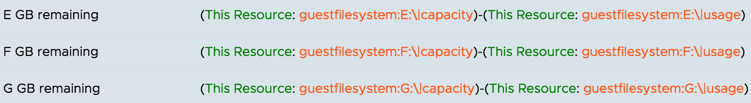
Next, duplicate that super metric for as many drive letters as you have (not counting D: if that’s your CD-ROM drive) and change the metric slightly so it references the drive letter. (Unfortunately, I don’t have a script that does this part for you.)
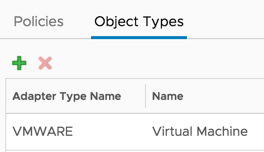
After creating the metrics, add the Virtual Machine as the object type.
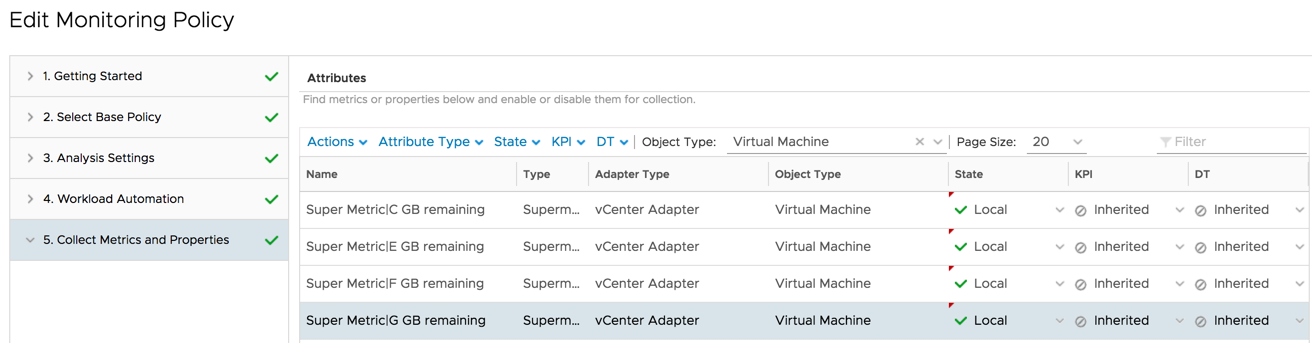
Go into your policy and activate these new super metrics. Save the policy.
After a couple collection cycles, you should see these new super metrics working and displaying data on your test VM. You can create a dummy file on a drive that occupies space to see if the super metric is reporting correctly. Something like fsutil file createnew E:\200mb 209715200 will get the job done.
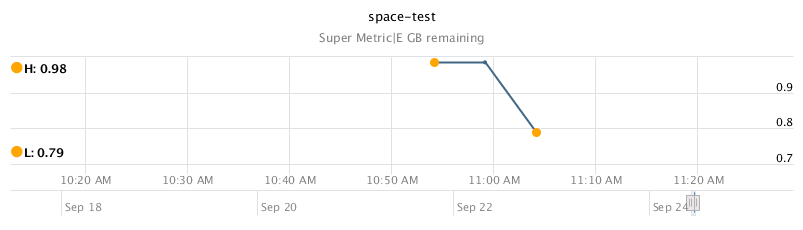
The high value seen above is before the 200 MB file was created, and the low value is after, proving the super metric is collecting accurately.
Next, we have to create a new symptom definition with these super metrics. Navigate to Alerts -> Alert Settings -> Symptom Definitions. In the metric explorer, change the object type to Virtual Machine. Click the strange button to the right of the “Metrics” drop-down menu and search for then select your test VM. The reason for this (and the whole reason why a test VM was necessary in the first place) is due to a rather unfortunate limitation in vROps to date, and that is you can’t select metrics from which to create a symptom definition just by virtue of them existing in the system. They have to be “active” on an object. If you were to expand the super metrics list there prior to selecting your test VM, you wouldn’t find them. Now that you’ve selected it, however, they appear. Drag-and-drop each of your super metrics into the symptom definition window. Change the definition to suit your needs.
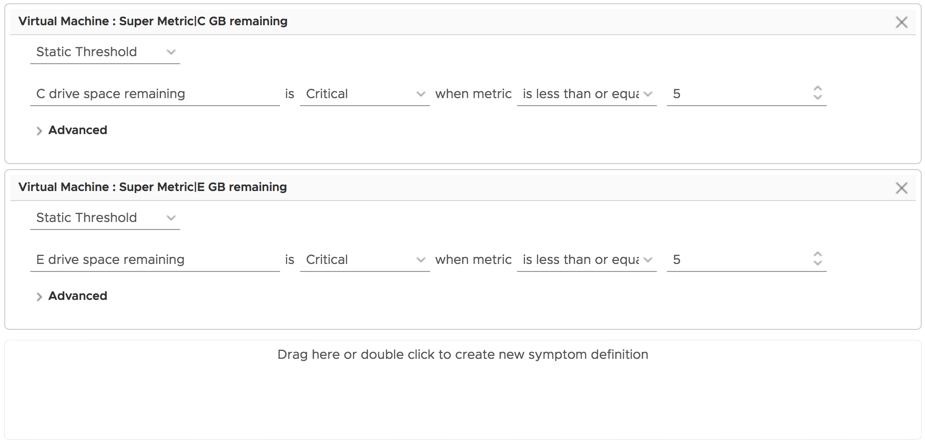
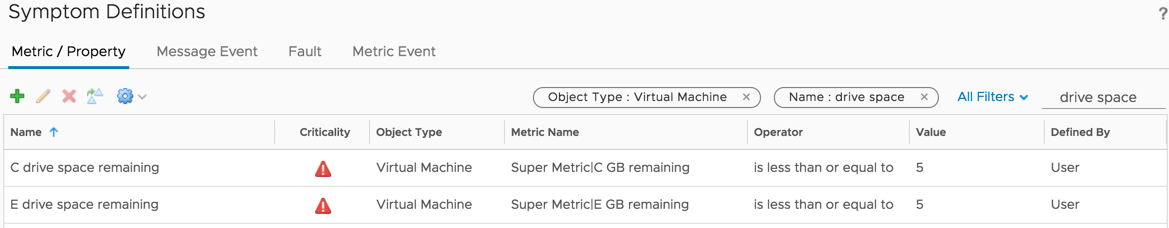
If you expand the Advanced section, you’ll see by default the wait and cancel cycles are set to 3. When complete, save your symptom definition. Once saved, you’ll notice there are individual symptom definitions created for each one. This is intended and rather nice since we don’t have to create them individually ourselves.
We’re almost done. At this point, we have to create a new alert definition that will make use of these symptoms. Walk through the new alert creation wizard giving it a name, description, selecting the base object type of Virtual Machine, setting an alert impact, and then adding symptom definitions. Drag each of them onto the definition so they’re stacked together and not separately. Change the evaluator to be “any” as shown in my example.
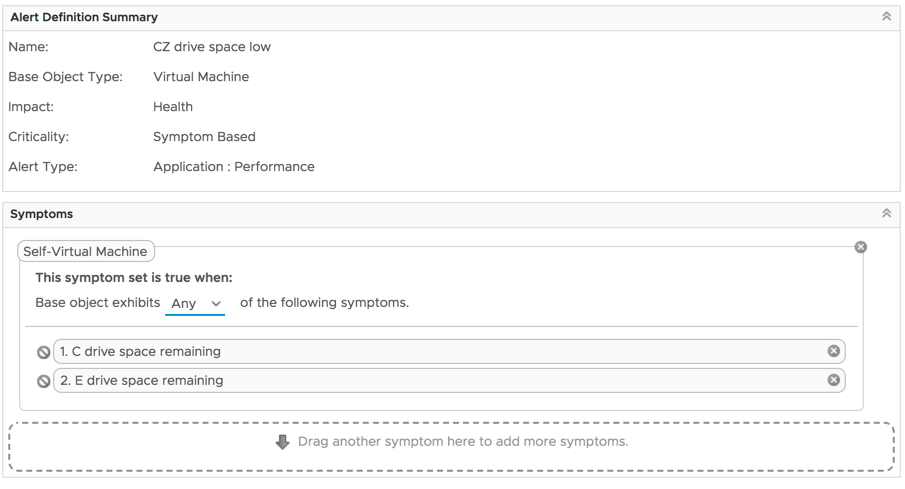
This will ensure that you only need a single alert definition to catch any of those symptoms that become true. Once saved, it’s time to test it out. Since I created my symptom definition with the condition that those super metrics need to be less than 5 GB space remaining, I have to increase the size of a drive. After that, fill it up with some test stuff.

Wait a few collection cycles and check to see if the alert fires.
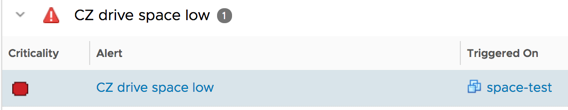
And there we go, we have an active alert on our test system. Since it’s a regular alert, we can do anything we want with it including sending to a CMDB, dispatching an email, generating a web hook, whatever.
Although this process is, shall we say, uncouth (due to VMware’s redaction efforts), we only have to endure the pain once and all future Windows systems will be covered. But there you have it, we have a good use case for super metrics and have plumbed them all the way through from simple metric to functional alert. Now it’ll be easier for you to integrate this into your process and hopefully keep a closer eye on those drives in the future.