Log Insight and Alerting When There Are No More Logs for Insight

Logging is an extremely important and, in some cases, essential part of a successful data center. That’s why you use a tool like Log Insight to aggregate, query, and alert on them. There are a variety of reasons why having your systems report their logs are crucial. They could be things like compliance: you are bound by law or maybe just company policy to keep log data for a certain period of time. They could be strictly for analysis reasons when you have an outage. If your ESXi hosts go down and they boot from USB or SD, you need to get at those logs. Or it could be because you’re running containers or some other stateless infrastructure where the only information that is worth saving is what’s in those logs. Whatever the reason might be in your case, you probably need some way to ensure that those logs continue to flow to whatever destination you use to store them.
vRealize Log Insight (vRLI) is one such tool you can use to aggregate and filter your logs. It’s a great tool in my opinion and has lots of great features, and its integration with other products in the VMware ecosystem is unmatched. One of the most powerful integrations is the one it has with vRealize Operations Manager (vROps). This is actually a bi-directional integration whereby vROps can display logs from vRLI, and in the other direction vRLI can send alerts to vROps. The latter is what I want to explore in this blog article, specifically in the scenario where you want to know if one of your systems stops logging.
Recently in my vRLI environment, I happened to notice that one of my agents hadn’t reported logs since I performed a software update on the system in question several weeks ago. Logs were flowing perfectly fine up until that point, but afterwards—even though the upgrade succeeded—no logs were sent, even after a reboot. In situations like that, you’re kind of blind. While the application works, you don’t receive any logs and probably don’t find out until you really need them. Clearly, we need a solution here. And since I already have vROps and vRLI integrated, this is a perfect opportunity.
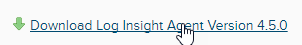
We want to create an alert inside vRLI that fires when a given system stops sending logs. While we can send that alert to a variety of destinations, since we use vROps we want to use that as our central alerting station and send it there. In this example, I’m going to make it so my Veeam ONE server throws an alert over to vROps when it stops reporting logs. I’m using the Log Insight agent, which I’ve already installed on the system. You can get this by navigating to Administration -> Agents, and scrolling to the bottom of the page. Click the button to download the agent.
Select the Windows MSI package.
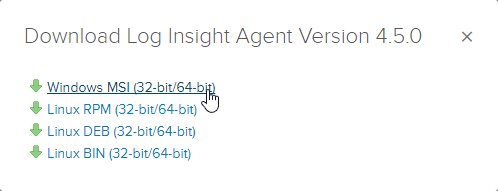
Store that package some place accessible to the system on which you want to install it. Do not rename the package since it contains the IP of your Log Insight server. Go to the host you want to forward logs and install it.
Next, we need to configure the agent to send logs. That’s a little outside the scope of this blog, but there are various ways to go about this, the simplest being to use Agent Groups. By creating an Agent Group, you define what log sources the agent should collect on, and which systems should get the definition. Think of it as a Puppet agent group if you’re familiar with that. It’s a common set of configurations amongst agent systems. Once your system is forwarding logs, it should show up in your Agents list.

Now, we need to ensure we’ve configured the integration with vRealize Operations. Go to that on the sidebar.
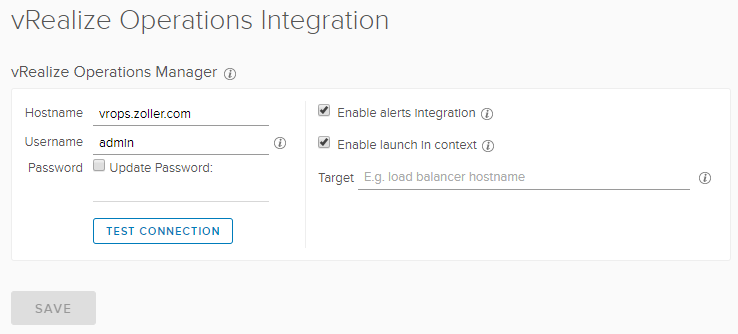
In my case, it’s just a lab so I’m using admin credentials. That’s probably not something you want to do in production, however. Make sure to enable the alerts integration.
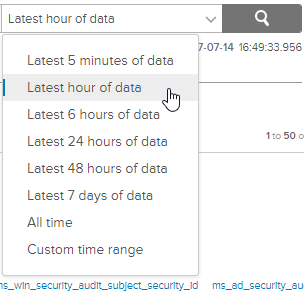
Go to Interactive Analytics and be sure we see logs from the source system for whatever the time window you want to check.

In this example, because I’m only monitoring Windows event logs currently and the system isn’t that active, I want to ensure I’m getting something at least every hour. Change the time range drop-down from “Custom time range” to “Latest hour of data”.
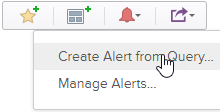
Once that’s done and you see logged data there, click the red bell icon to the right of it and select “Create Alert from Query”.
A new Alert definition window will appear where we can fill in our relevant information. Mine looks like this.
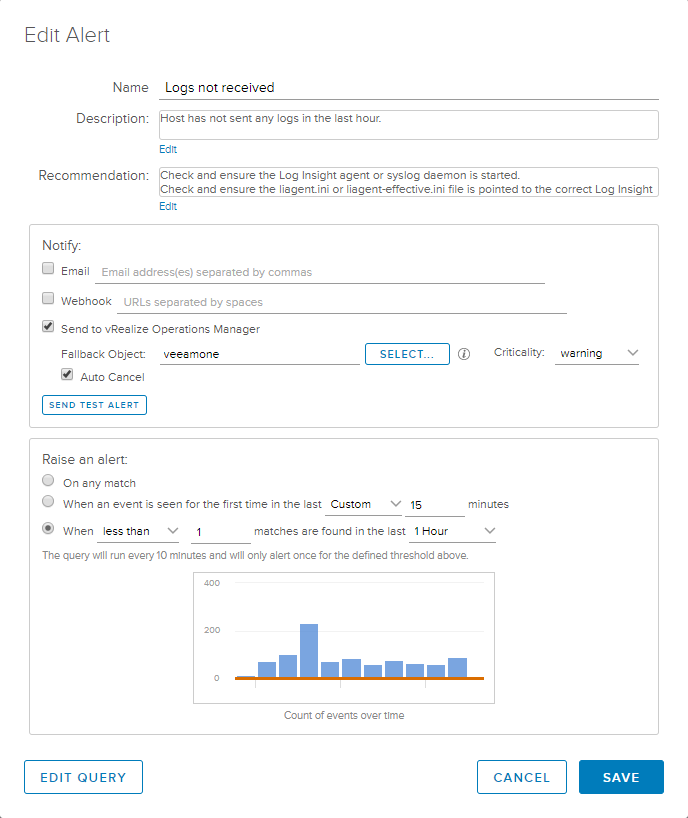
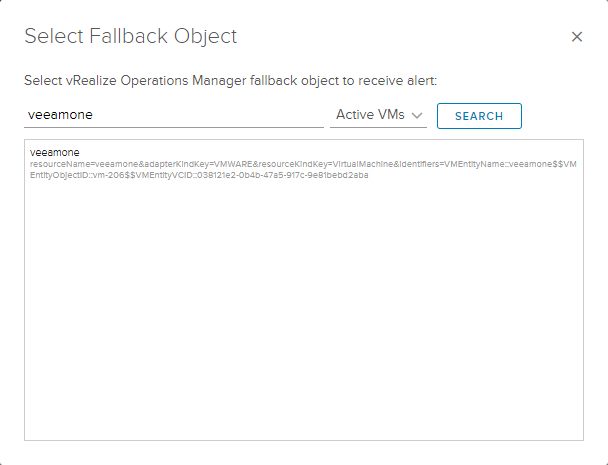
Remember that the description and recommendation sections are what will show up in vROps as well, so make it descriptive and helpful if others are supposed to take action. Check the box to Send to vRealize Operations Manager and click the Select button to find the system in your query.
Optionally, check the box to “Auto Cancel” the alert if the condition later becomes false. In other words, if logs miraculously begin flowing once again, tell vROps to cancel the alert that was previously active.
Down on the “Raise an alert” portion, we need to select the last radio button and define when less than 1 matches are found in the last 1 hour. Refer to the above screenshot to see the full definition. Now, you might be asking (as I did) why it is necessary to manually pick the object from within vROps’ inventory if this is merely a fallback object? It’s a valid question and, I’m afraid, the answer is because this is either a bug or a known issue. I hope they can fix this in future versions and I’ve brought it up to the Log Insight team.
Anyhow, once you’ve defined your alert, make sure you click the button to “Send Test Alert” and verify in your vROps system that a new alert is active for the object you specified. If this does NOT produce that result, stop and check your integration. You may need to remove and reconfigure it to get it to work.
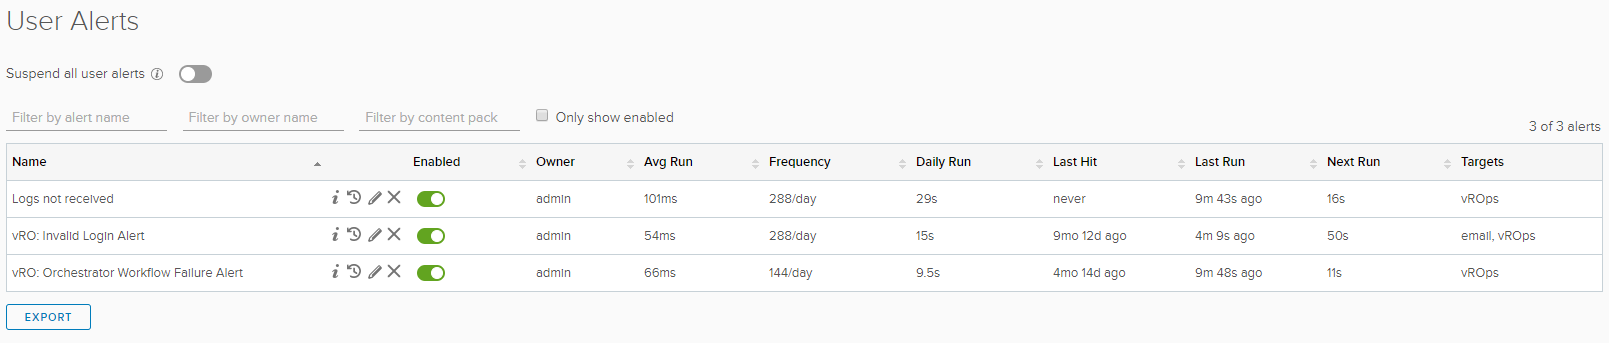
Save the alert definition making sure it is active. You can view any you’ve configured under Administration -> User Alerts.
To test, go to your host system and stop the service named “VMware vRealize Log Insight Agent”. Flip over to your vROps system and watch the Alerts pane for your new alert to fire. Keep in mind that any alerts configured in vRLI are actually background queries that run every five minutes, so if you don’t see the alert show up in vROps exactly the second you think, give it a little more time. Ultimately, however, you should see the following alert fire in vROps.
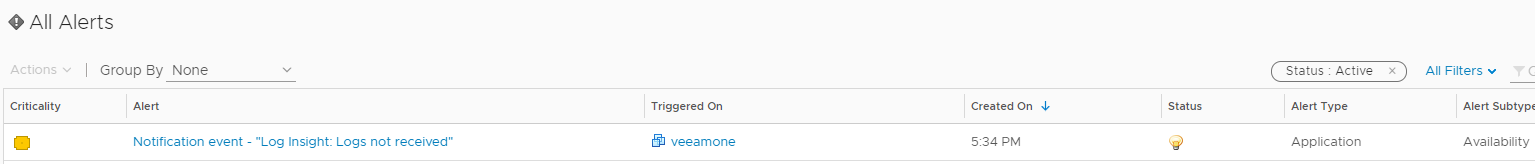
If we click on the alert, we can see the description and the recommendations we set.
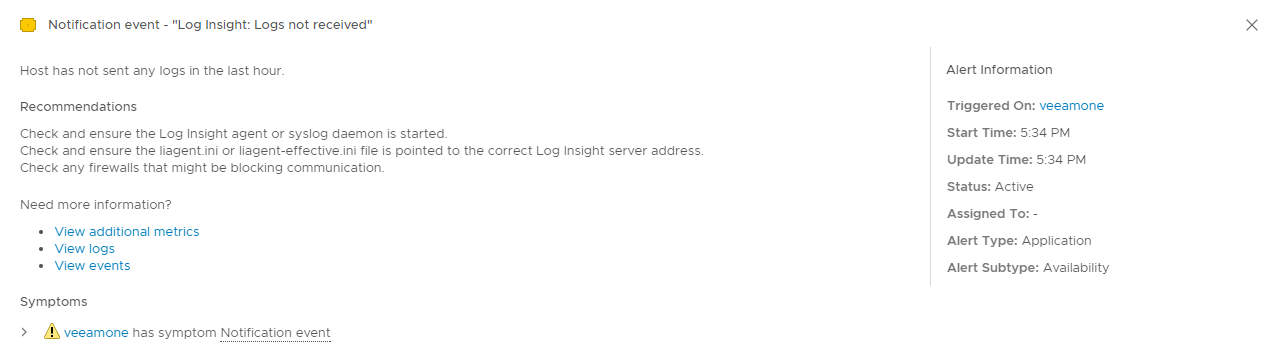
Also, the severity is what we also set in the vRLI alert definition. If we start the Windows service up once again, the alert should clear in a couple minutes. Pretty cool, huh? Now, since vROps has the alert in-hand, we can do whatever we want with it inside vROps be that sending an email or the like.
With this setup I’ve demonstrated, you can be alerted within vROps when one of your critical systems stops sending logs to our Log Insight cluster, prompting you to investigate. But as cool as this might be, I can feel what some of you might be thinking. It goes something along the lines of, “that’s great, but I have to do this for each and every system I want to make sure are sending logs?” and the answer I have for you is, unfortunately, a “yes.” In the future, I hope to see some better solution within vRealize Log Insight where it is possible to define a group of hosts or agents that should be watched and alerted on. If you believe the same, I urge you to go vote for the feature request on the Log Insight website here.