Real-world troubleshooting with Log Insight

Having some sort of log aggregation tool is an extremely important addition to any sort of management or monitoring system, so much so that it can mean the difference between violating SLAs, losing customers, or lengthier outages, and not. Log Insight is a product in the vRealize Suite which is this kind of tool and is way more capable than performing log searches on just vSphere components. Here is one such example of how I used VMware’s Log Insight to solve a real-world production issue in our internal lab.
Recently, we were alerted to an issue in the event logs that was observed on the new SovLabs hosts. The messages observed resembled the following:
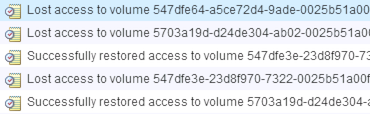
The same messages were observed on not only SovLabs hosts, but indeed any hosts that were on ESXi 6U2. This issue was apparently causing poor performance and periodic service disruptions.
After some initial investigation, it was found the SovLabs hosts had recently been updated to ESXi 6U2 after being initially installed with 6U1b. Additionally, when similar messages were found on hosts in other environments (even those on different physical type servers) the messages only referenced datastores backed by XtremIO and no other storage platforms.
These messages which show access to a datastore had been lost and reestablished happened in quick succession. They only appeared on hosts at 6U2 as a test was performed by re-installing a single host with 6U1b and examining hosts on even earlier versions. This indicated there was a change introduced with Update 2 which was responsible.
Several theories were tested including possible driver mismatches, the leading theory being a change introduced in vSphere 5.5 U2 which is known to cause similar events due to the way VMFS heart beating was altered. In this change, SCSI-3 reservations were replaced with the VAAI primitive command ATS as a way to perform locking to determine status via heartbeat. The setting was reverted on a select few hosts to see if, somehow, it could have been responsible. The change had no effect.
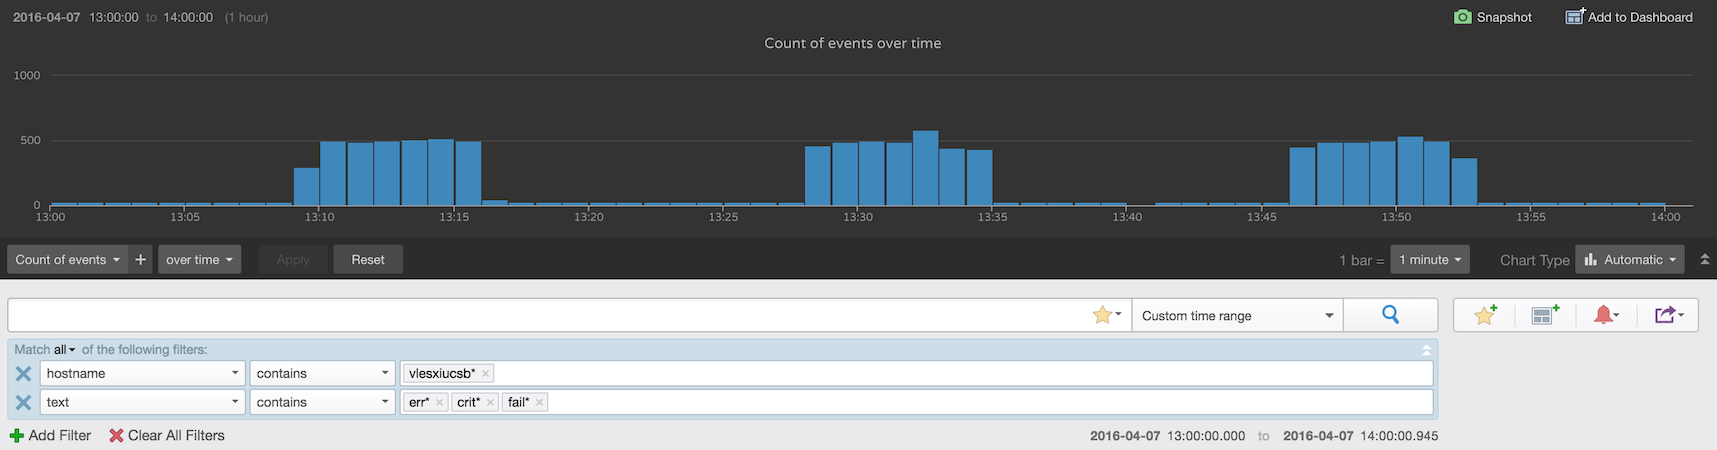
More details were needed to go further. Fortunately, all hosts in Lab and Prod are pointed at a Log Insight instance, so all the hosts’ logs are available. Not only that, but with the vSphere content pack, pre-created dashboards are available that have many troubleshooting views built in. Starting with a simple query which finds errors, a similar dispersion pattern appeared:
I could also see that these errors were indeed mainly limited to the hosts on 6U2 with the built-in dashboard.
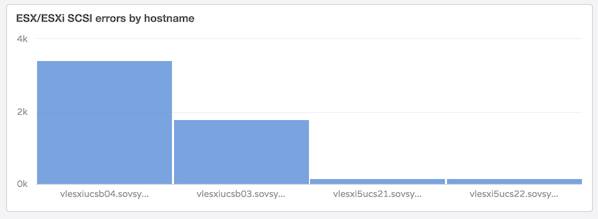
That’s between 2,000 and 4,000 errors returned in just a single hour!
What was clear here was that these errors occurred roughly in blocks of 30 minute chunks, the errors were transient and the datastores recovered, and these blocks had some overlap between hosts. Further detail showed that the 30 minute interval was consistent across hosts, but it began and ended at different times. This detail indicated the problem was most likely not via external influence but caused by a host-initiated event which was reoccurring in a programmatic basis, not on an event basis.
I decided to dive into some of these messages to see what was going on in finer detail, and I found many similar events with failed I/O types citing the SCSI sense codes relevant in the transaction.

I needed to see how widespread these were to correlate them across the other host to see if these were consistent. Fortunately again, there is a pre-built dashboard expressly for this purpose.
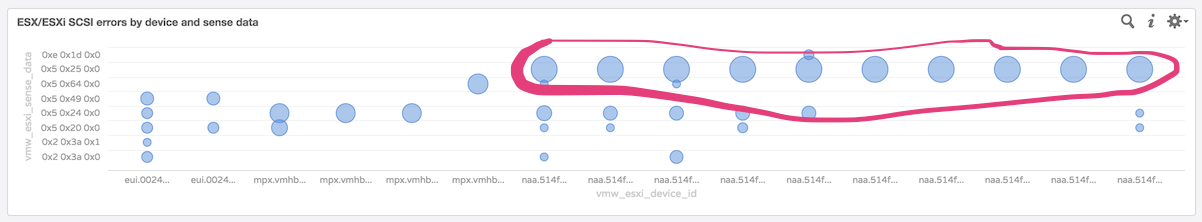
I could see by mousing over the large circles in this scatter graph that the same sense codes were being returned in bulk on all the device IDs hosted by XtremIO.
After looking up and understanding these SCSI sense codes, the ones most frequently seen, in hex, are 0x5 0x25 0x0, which corresponds to an ILLEGAL REQUEST (0x5 sense) and LOGICAL UNIT NOT SUPPORTED (0x25/00 additional sense). This told me something occurred in the system that was not sending I/O to the device or returning illegal requests.
Digging deeper, prior to these messages, I found several originating from the host which included a SCSI command of 0x85 followed by a stream of events such as the following:

This indicated that the host thought the datastore in question was under a Permanent Device Loss (PDL) condition, which the array informed the host of via SCSI sense data. PDL is unique as opposed to All Paths Down (APD) by the array telling the host, “hey, this device is gone permanently”. In an APD condition, it is transient with no sense data provided, so the hosts assumes the device will return. Something like a cable pull or HBA disconnect might cause this.
Finally, after checking the relationship between these sense codes, I got a picture of what was going on: The host, on about a 30 minute interval, was issuing a 0x85 code to each device on the backend array. The devices on XtremIO responded with SCSI sense codes telling it that was an illegal request, which then initiated its PDL timer where it holds all existing I/O destined for that device and attempts to retry SCSI commands to determine if the device is truly gone. Because of this, I/Os issued from running VMs are queued in favor of kernel SCSI commands to determine if it should continue to issue them to the backend. If the timer expires, the host determines the device is dead, however in all cases, a response was returned that indicated I/O could resume.
Ok, fine, I understand the I/O sequence, so what is 0x85 and why was it triggering this false condition? I looked up some sense codes and found this was an ATA command. Further checking showed it was an inquiry to get the health of the device. So what subsystem queries storage periodically to make sure it¹s ok and is in good health? There is only one major system, and it just so happens there is a specific daemon responsible for its operation. This process is the S.M.A.R.T. detection system and operates on just about all operating systems, including ESXi and Linux, via the smartd daemon. Checking the status of this in ESXi shows it is indeed running.
About this time and some specific searches later, I ran across this KB article which confirms my suspicion and offers the workaround to stop and disable smartd, however the real cause being that the array is responding to a 0x85 request in an incorrect manner and ESXi acted appropriately and began to see if this device was permanently removed. This must be corrected on the array side with a patched firmware.
After test disabling smartd and turning the service off in chkconfig so as to not be brought up by a watchdog service, the errors went away and I/O flows without disruption. This is not ideal in most cases, because disabling smartd means SMART testing will not be performed for local devices. For ESXi hosts which do not contain nor boot from local hard drives, this is less of an issue.
It turns out this was a known issue with XtremIO and noted in https://support.emc.com/kb/467750, which was fixed in v4.0.2 build 80. After upgrading the XtremIO code, smartd could be turned back on and the errors went away. Use Log Insight for not only your VMware landscape but for your physical infrastructure as well and you’ll be well on your way to a well-monitored SDDC.