Detecting PSC Replication Failure with Log Insight

In vSphere 6, the Platform Services Controller (PSC) contains a number of pieces of functionality including the SSO components, certificates, licensing, and other core parts that make vCenter function. Because of its importance, it is possible to join external PSCs that share the same SSO domain in a replication topology whereby their states are kept synchronized. When a change is made to, for example, a vSphere tag, that change is asynchronously replicated to the other member(s). In the instance where a single PSC failed, vCenter could be manually repointed to another PSC that was an identical copy of the one that failed. Use of a load balancer in front of replicating PSCs can even provide automatic PSC switching so a manual repointing is unnecessary. This is all well and good and tends to work just swimmingly, however what happens when PSC replication fails? Bad things happen, that’s what. The natural and next logical question to ask then becomes, “how can I know and be informed when my PSCs have stopped replicating?” To this, unfortunately, there doesn’t seem to be an out-of-the-box way that is displayed in any GUI present in vSphere 6.5. Although you can setup replication through the GUI-driven installer when deploying PSCs, that’s basically the end of the insight into how replication is actually functioning. And when vCenter is pointed at a PSC with a replica partner, the additional PSC shows up under System Configuration in the web client yet does not inform you of replication success or failure.
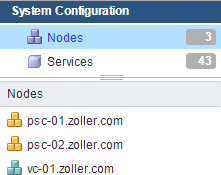
Clearly, there is room for improvement here, and like the majority of my articles I want to try and find a solution where one currently doesn’t exist. In this one, I’ll show you how you can use a combination of Log Insight and vRealize Operations Manager to be informed when your PSCs stop replicating.
In my lab I’ve setup two PSCs in the same site and same SSO domain (vsphere.local) which are replica partners. I have a single vCenter currently pointed at PSC-01. When I make a change to any of the components managed by the PSC through vCenter (or even the PSC-01’s UI at /psc), that change is propagated to PSC-02. This replication happens about every 30 seconds. By logging into PSC-01, we can interrogate the current node for its replication status using the vdcrepadmin tool. Since its path is not stored in the $PATH variable, it’ll have to be called directly.
1root@psc-01 [ / ]# /usr/lib/vmware-vmdir/bin/vdcrepadmin -f showpartnerstatus -h localhost -u administrator -w VMware1!
2Partner: psc-02.zoller.com
3Host available:   Yes
4Status available: Yes
5My last change number:             1632
6Partner has seen my change number: 1632
7Partner is 0 changes behind.
From this message we can see its replica partner (psc-02.zoller.com), if it’s currently available, the last numbered change seen by the source PSC, the last numbered change seen by the replica partner, and then how many changes behind that represents. When everything is functioning properly, you should see something like above. If you were to run the same command on PSC-02, you’d get very much the same response minus the change numbers.
Now, if I go over to PSC-02 and stop vmdird, the main service responsible for replication, and re-run the vdcrepadmin command on PSC-01, the message would look like the following.
1Partner: psc-02.zoller.com
2Host available:   No
And if we look at the log at /var/log/vmware/vmdird/vmdird-syslog.log, we see corresponding failure messages.
117-11-29T14:48:00.420592+00:00 err vmdird t@140610837108480: VmDirSafeLDAPBind to (ldap://psc-02.zoller.com:389) failed. SRP(9127)
Yet despite replication obviously failing, vCenter shows no change in status. Although there is a pre-built alarm in vCenter called “PSC Service Health Alarm” this only applies to the source PSC (where vCenter is currently pointed) and has no knowledge of replication status. Total bummer as you’d really hope to see something trigger inside vCenter. Maybe one day. (Cue sad face and violins.)
Anyhow, if vCenter won’t do it for you, we’ll do it ourselves. Since we know the logged messages that occur when failure is upon us, we can use Log Insight to notify us. And, furthermore, if we integrate Log Insight with vROps, we can send that alert to vROps and have it associated to the correct PSC virtual machine. For this to work, we obviously need both applications, and we also need to integrate them. See some of my other articles that cover this as I won’t spend time on it here, but it’s a pretty simple process.
After they’re stitched together, we need to get logs from our PSCs over to Log Insight. Log into the VAMI for each PSC on port 5480. Plug in your vRLI host in the Syslog Configuration portion as shown below.
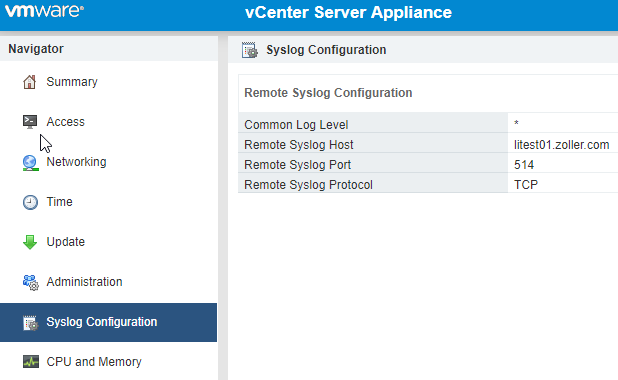
Do this for both PSCs.
NOTE: Although the Log Insight agent can also be installed on the PSCs to provide better logging, it is not required if you want visibility into the replication process.
Verify from your vRLI server that logs are indeed being received from those sources. They should show up in Interactive Analysis and Administration -> Hosts.
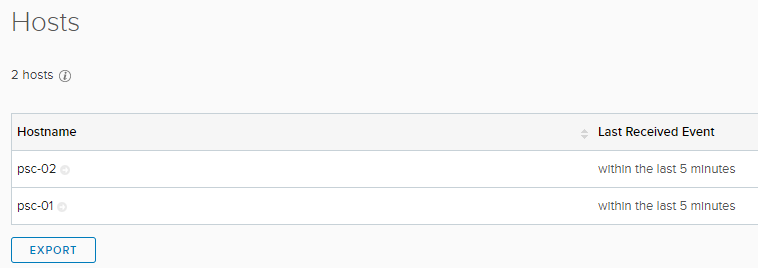
Also confirm that the vmdird log stream is coming in. Since Log Insight already extracts the proper fields, we have the convenience of just asking for that stream directly in a query.
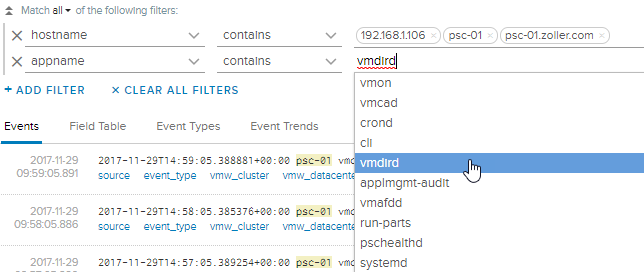
Change the resolution to a longer period to ensure logs are there. And if you want to watch how logs change based on activities you perform on the PSC, try to create a new user in the internal SSO domain, add a license, or create a vSphere tag. Update the query you’ve built and see what you get.
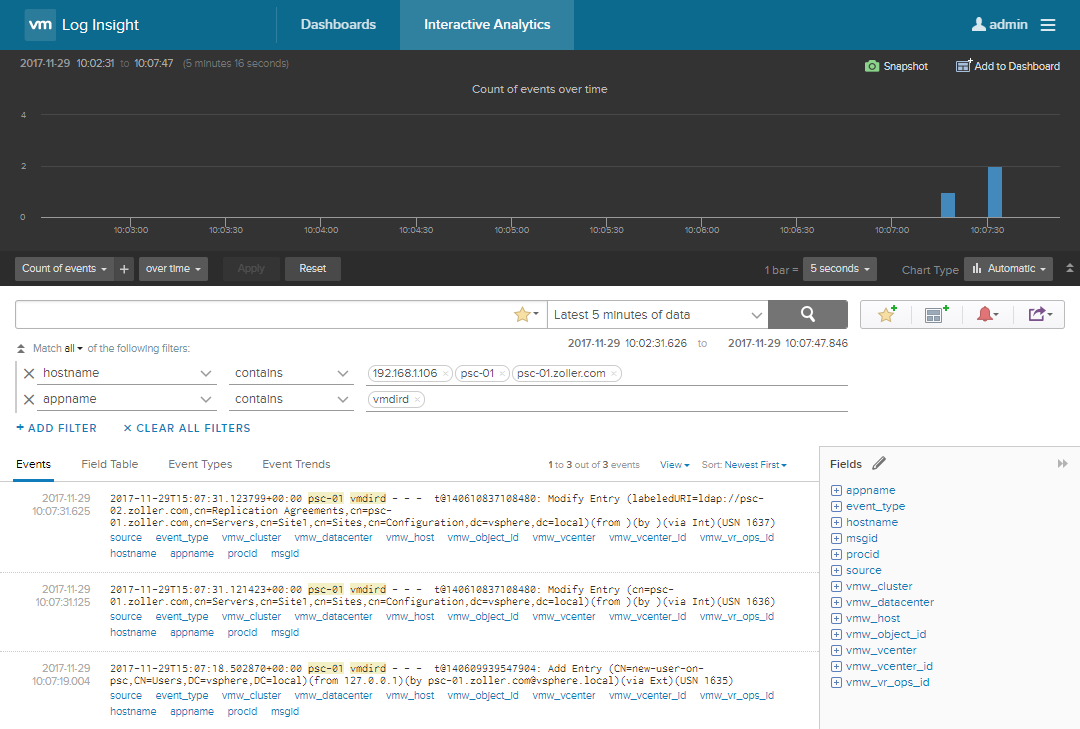
Starting at the bottom, you might be able to figure out I added a new user, and then about 15 seconds later that change was replicated to the peer PSC as evident by the top line.
Once we have verified good logs, we can create an alert based on them. Stop vmdird on the PSC replica and watch the failure logs come rolling in.
1root@psc-02 [ ~ ]# service-control --status
2Running:
3 applmgmt lwsmd pschealth vmafdd vmcad vmdird vmdnsd vmonapi vmware-cis-license vmware-cm vmware-psc-client vmware-rhttpproxy vmware-sca vmware-statsmonitor vmware-sts-idmd vmware-stsd vmware-vapi-endpoint vmware-vmon
4root@psc-02 [ ~ ]# service-control --stop vmdird
5Perform stop operation. vmon_profile=None, svc_names=['vmdird'], include_coreossvcs=False, include_leafossvcs=False
62017-11-29T15:12:57.617Z   Service vmdird does not seem to be registered with vMon. If this is unexpected please make sure your service config is a valid json. Also check vmon logs for warnings.
72017-11-29T15:12:57.617Z   Running command: ['/sbin/service', u'vmdird', 'status']
82017-11-29T15:12:57.655Z   Done running command
9Successfully stopped service vmdird
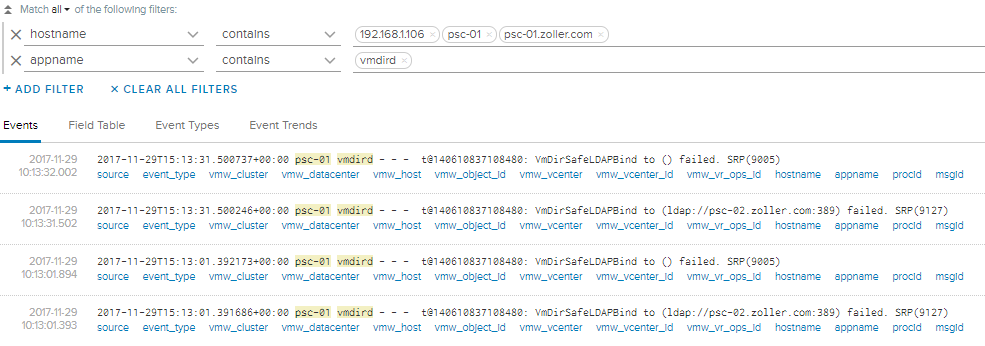
We can see the failure messages now, and from these we can create a new alert. Highlight the “VmDirSafeLDAPBind” part and add it to the query.
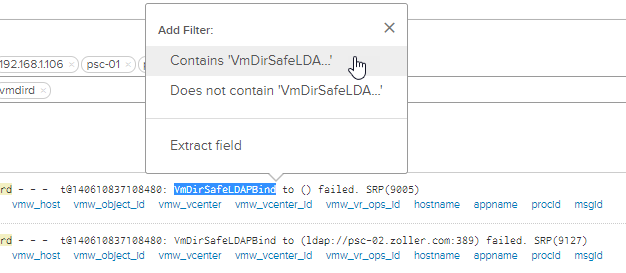
Now, highlight “failed” and do the same. Put them on two separate lines because entries on the same line are effectively an OR statement. Your built query should look like the following.

Remove the hostname portion so as to make this alert more general. Now, on the right-hand side, create an alert from this query.
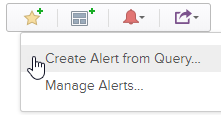
Complete the alert definition including description and recommendation as these are fields that will show up when we forward it to vROps.
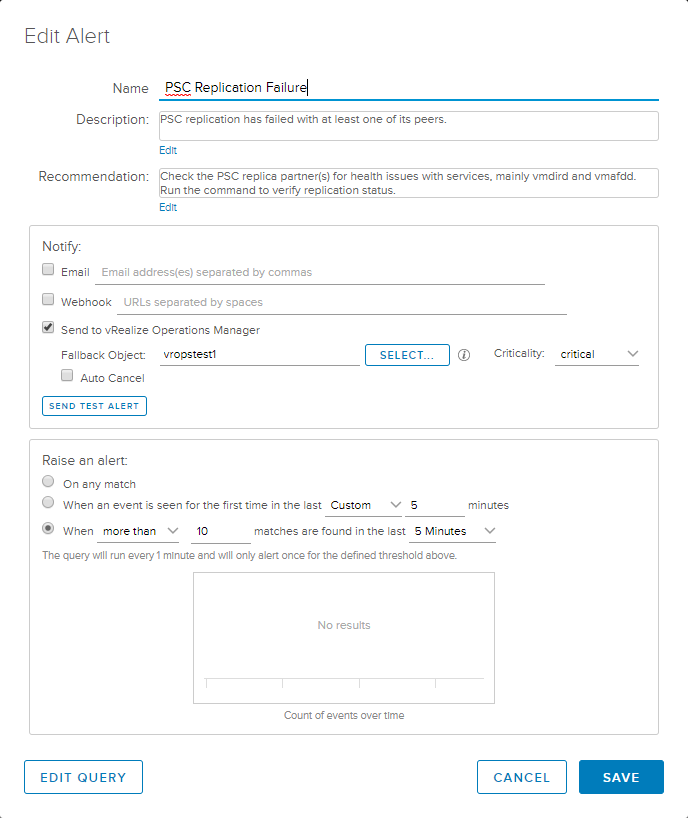
Check the box to Send to vRealize Operations Manager and specify a failback object. This is the object with which vROps will associate the alert if it cannot find the source. Set the criticality to your liking. Finally, on the Raise an alert panel at the bottom, select the last radio button and choose “more than” with a number less than 20 in the last 5 minutes. Since the PSCs replicate approximately every 30 seconds and two messages match the query every period, the result would produce 20 logged entries in a 5-minute period, so you want to stay under that if your timeline is 5 minutes. Save the query and be sure to enable it.

With the alert configured, saved, and enabled, let’s give it a try and see what happens. On your PSC replica, again stop vmdird with service-control --stop vmdird and wait a couple minutes. Flip over to vROps and go to Alerts.

Great! The alert fired, got sent to vROps, and even was correctly associated with PSC-01, the PSC from which the errors were observed. And the description and recommendations that were configured for the alert also show.
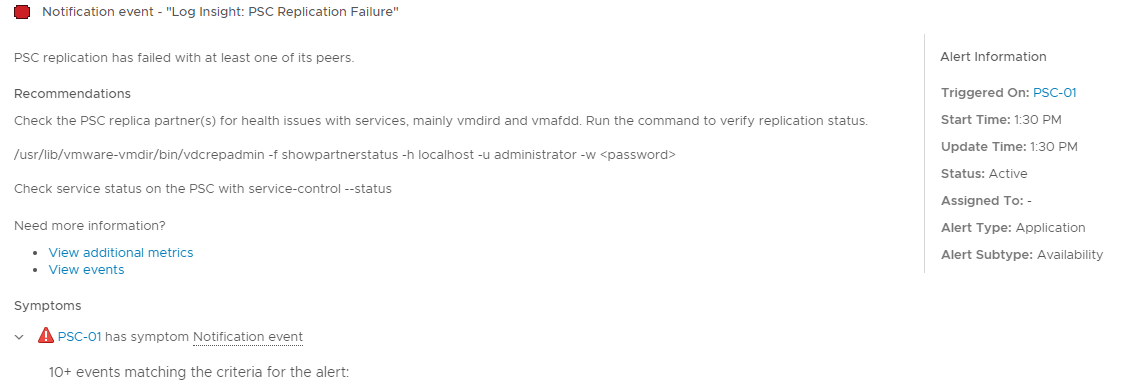
Now you’ll have some peace of mind knowing that your replication is working properly, and if not when it occurred. I’m also providing my Log Insight alert definition that you can easily import if you’d prefer not to create your own. So hopefully this makes you sleep a little bit better knowing that you won’t be caught off guard if you need to repoint your PSC only to find out it’s broken.